When the trade route ran short of water
Drought forced limits on how many ships could pass through the Panama Canal. By late 2024 crossings had risen again, and the Canal earned more money than the year before even though fewer ships went through.
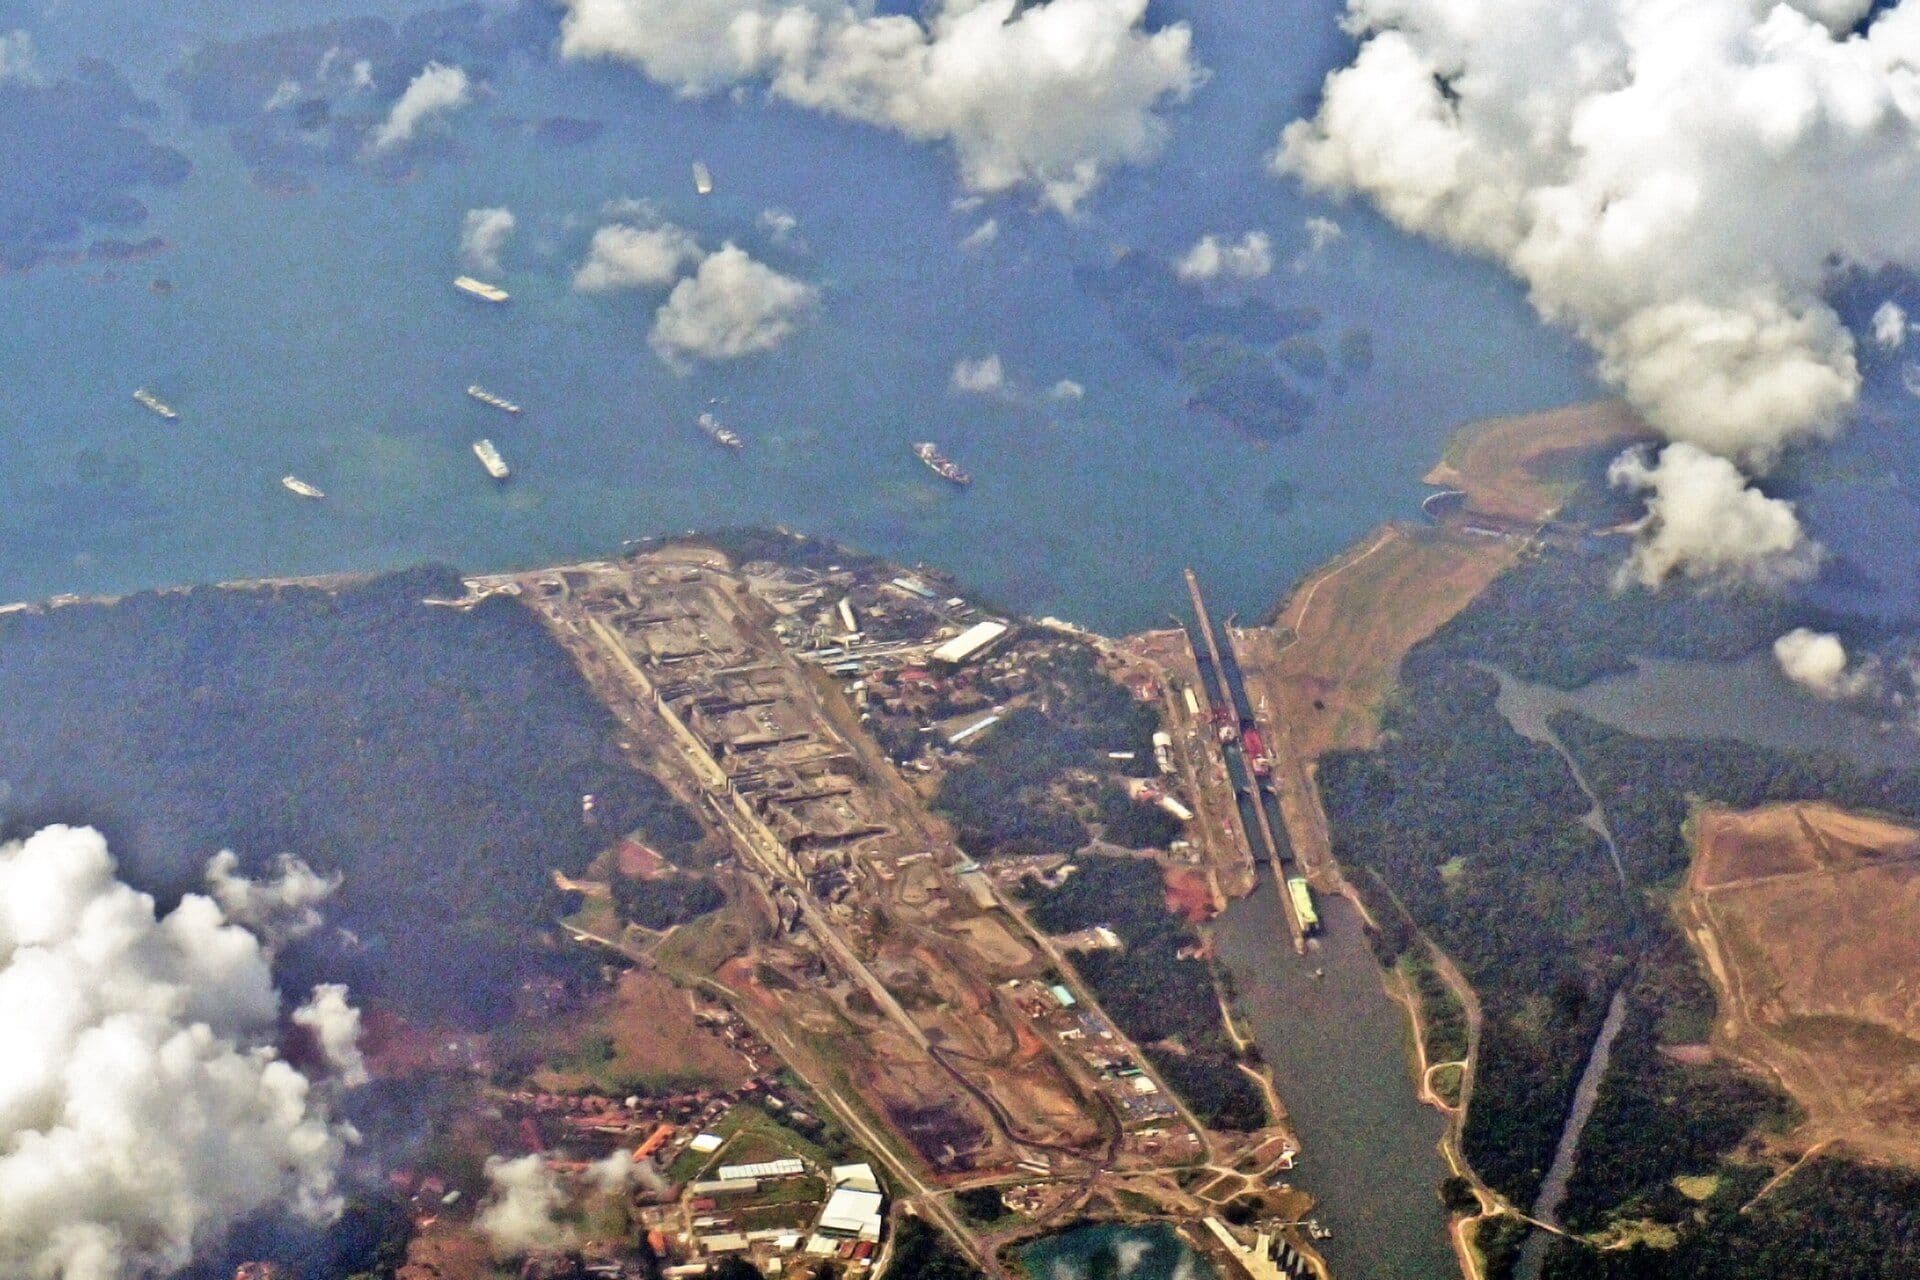
Panama · Water · World trade · Period covered: 2023–2024 · Document review: October 19, 2026
A canal that runs on rainwater
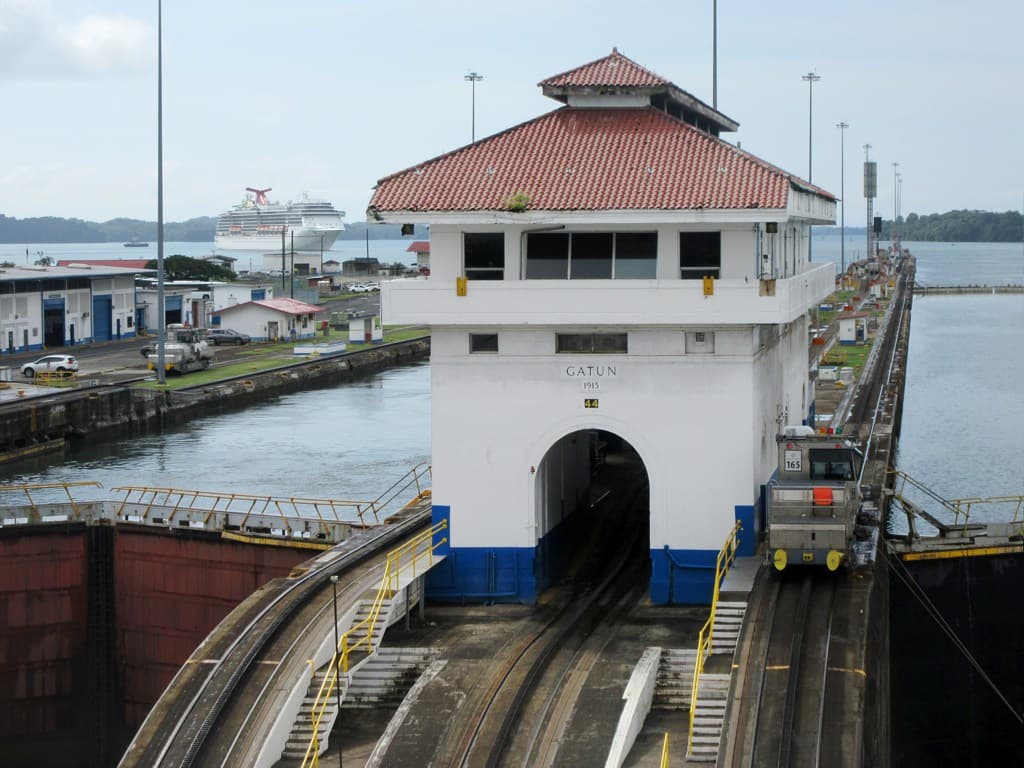
Every ship that crosses the Canal uses fresh water from its lakes to be raised and lowered in the locks. That same water supplies much of Panama's population. When little rain falls, the Panama Canal Authority (ACP) has to decide how many ships can pass. S02
To follow the story, three things that look alike have to be kept apart: the slots that can be booked, the ships that actually crossed and the cargo they carried. They are different measures.
The schedule that changed
- LimitFrom this date, capacity stands at about 32 ships a day, according to a later ACP advisory. S01
- PlanThe ACP announces a stepped reduction down to 18 daily slots from February 2024. S01
- ReplacedA new schedule replaces the previous one: 24 slots from January 16, 2024. The cut to 18, planned for February, was called off before it was applied. S02
- Recorded702 oceangoing ships cross during the month. S03
An announcement is a plan, not a fact. That is why the 18 slots are not presented as the low point: the plan was changed before it took effect.
The recovery shows in the crossings
Average = crossings in the month ÷ days in the month. Source: ACP monthly operations summaries. S03S04S05
| Month of 2024 | Oceangoing crossings | Days | Daily average |
|---|---|---|---|
| January | 702 | 31 | 22.65 |
| September | 958 | 30 | 31.93 |
| December | 1,059 | 31 | 34.16 |
In December, on average, 50.9% more ships crossed per day than in January. These are selected months: they do not prove that the improvement was continuous, or that every type of ship recovered equally.
The Canal's fiscal year runs from October to September. Counted that way, and adding up every kind of vessel, the annual report records 14,080 transits in fiscal year 2023 and 11,240 in fiscal year 2024: 20.2% fewer. S06S07
Drop: (11,240 ÷ 14,080 − 1) × 100 = −20.2%. Source: ACP, 2024 annual report, chart 5. S06
What the science allows us to say
World Weather Attribution, a group of scientists who study whether climate change influenced a specific event, linked the lack of rain in 2023 to the low level of Gatún Lake and analyzed the role of El Niño and of demand for water. S09
Their analysis could not conclude that the observed decrease in rainfall was due to human-caused climate change. That does not prove the opposite: that warming had no influence at all.
That the water shortage forced limits on transits is documented. What cannot be calculated from these data is what share of the whole drop in traffic was due to that alone.
Different effects for each actor
Shipping: an example from one sector
The US Energy Information Administration (EIA) documented that shipping liquefied petroleum gas, mostly propane, in large vessels from Houston to Chiba (Japan) cost as much as 250 dollars per ton in the week ending September 29, 2023. The EIA attributes this to the delays at the Canal, combined with demand for propane in Asia. Two weeks later it cost 176: according to the EIA, with freight rates that high, charterers pulled out of the market and more ships became available. This is an example of one route and one type of cargo, not of all ships. S10
The Canal: lower tolls, higher profit
The ACP's audited accounts make it possible to look at each item separately. The figures are in balboas, Panama's currency, which is worth the same as the dollar. S08
Scale from 0 to 6,250 million. Source: financial statements audited by KPMG as of September 30, 2024, page 8. S08
| Millions of balboas | 2023 | 2024 | Change |
|---|---|---|---|
| Tolls | 3,348.4 | 3,179.1 | −5.06% |
| Other transit services | 1,458.5 | 1,659.6 | +13.79% |
| Total revenue | 4,968.0 | 4,986.0 | +0.36% |
| Net profit | 3,205.7 | 3,438.6 | +7.26% |
Tolls fell 5.06%, but what the Canal charged for other transit services went up and made up for that drop. Total revenue grew 0.36% and profit 7.26%. Lower expenses and higher financial income also played a part in the profit, so the whole gain cannot be attributed to the slot auctions.
Consumers: a scenario, not a bill
The UN trade and development agency (UNCTAD) simulated that the Red Sea and Panama problems, taken together, could raise the global consumer price level by 0.6% toward the end of 2025. The simulation assumes that the higher freight costs last through the whole period. It is a conditional projection, not a measurement of what happened, and it does not separate the effect of Panama from that of the Red Sea. S11
One episode, different angles
| Piece | What it focuses on |
|---|---|
| AP, January 2024 S12 | The restrictions and the economic damage expected at the height of the crisis. |
| Reuters, May 1, 2024 S13 | El Niño and water management, in its report on the scientific study. |
| ACP, fiscal year 2024 results S14 | The Canal's management and resilience. It is also the institution this story is about. |
A forecast of losses in January and an annual result in October do not, by themselves, contradict each other: they measure different things on different dates. In its coverage of the scientific study, Reuters's wording is more categorical than the scientists' “could not attribute”; here we go with the scientists' version.
These are three specific pieces. We do not assess all of the coverage, and we do not rate these outlets.
Panama and the Red Sea
They are two different problems that affect the same maritime transport system. UNCTAD studies their combined effect on freight rates and the economy. That does not mean one crisis caused the other. S11
What we don't know
- Whether every type of ship recovered equally: we did not check by segment.
- How much prices rose in each country because of Panama alone.
- What exact share of the drop in traffic was due to the lack of water.
- Why there is a one-ship difference between INEC and the ACP.
How we did it
We gathered operating advisories, statistics, audited accounts, a scientific study and three pieces of coverage. The figures were checked against the original documents during the research (October 19, 2026) and opened again one by one on October 21; we recalculated every average and percentage. The AP and Reuters articles were read in copies published by other outlets with the agency's credit, because their websites did not open. KPMG's audit certifies the accounts, not the traffic statistics in the annual report.
We did not conduct interviews or make our own calculation of causes. The research and writing were done with the help of artificial intelligence and reviewed by the editor of The Contrast; there was no independent outside verification. If we correct anything, we will note it here with the date.
Correction, October 21, 2026: we clarified the week of the EIA freight figure and the reason it came down, the scope of World Weather Attribution's conclusion (the decrease in rainfall) and the date of the ACP's schedule change. No figure changed.
English version, October 22, 2026: translated from the Spanish original with the help of artificial intelligence and reviewed by the editor of The Contrast. Same facts, figures and sources; document titles are left in their original language.
Sources
- S01ACP, advisory A-48-2023, Oct 30, 2023, p. 1. PDF
- S02ACP, “Panama Canal to increase daily transits to 24 starting in January”, Dec 15, 2023. Press release · advisory A-54-2023
- S03ACP, monthly operations summary for January 2024 (A-04-2024), p. 1. PDF
- S04ACP, monthly operations summary for September 2024 (A-38-2024), p. 1. PDF
- S05ACP, monthly operations summary for December 2024 (A-01-2025), p. 1. PDF
- S06ACP, Annual Report 2024, p. 34, chart 5. PDF
- S07INEC Panamá (national statistics institute), table 34: vessel transits by draft, by quarter (2024 is preliminary; the data come from the ACP). PDF, in Spanish
- S08ACP, financial statements as of Sep 30, 2024, audited by KPMG, p. 8. PDF, in Spanish
- S09World Weather Attribution, “Low water levels in Panama Canal due to increasing demand exacerbated by El Niño event”, May 1, 2024. Summary · study
- S10EIA, Josh Eiermann, “Drought at the Panama Canal delays energy shipments, increasing shipping costs”, Oct 31, 2023. Analysis
- S11UNCTAD, Review of Maritime Transport 2024, pp. 78–79. PDF
- S12Associated Press, “Panama Canal traffic cut by more than a third because of drought”, Jan 17, 2024 (read in a copy credited to AP: the AP website did not open). Article
- S13Reuters, Jake Spring, “El Nino, water management issues blamed for snarling Panama Canal”, May 1, 2024 (read in copies credited to Reuters: the Reuters website did not open). Article
- S14ACP, “Panama Canal Presents Financial Results for FY24 with a Focus on Sustainability and the Future”, Oct 25, 2024. Press release
Keep reading
 What is going wrong on Spain's high-speed rail network?Spain · Trains · Ongoing story · 2015–2026
 Human error or system failure? What is known about the Urda train crash and what is still missingSpain · Trains · Ongoing story · 2026
 Venezuela: what is proven and what is allegedVenezuela · Institutions · Human rights · Justice · 1999–2026
The Contrast · Stories in context · Published October 20, 2026; English version October 22, 2026. More stories